Decoding Revenue Attribution Models: A Guide to Choosing the Right One for You
As a digital marketing manager, you know how important it is to measure the impact of your marketing efforts on your revenue. But how do you know which marketing channels, campaigns, and touchpoints deserve the most credit for driving sales? How do you allocate your marketing budget and optimize your strategy based on data-driven insights?
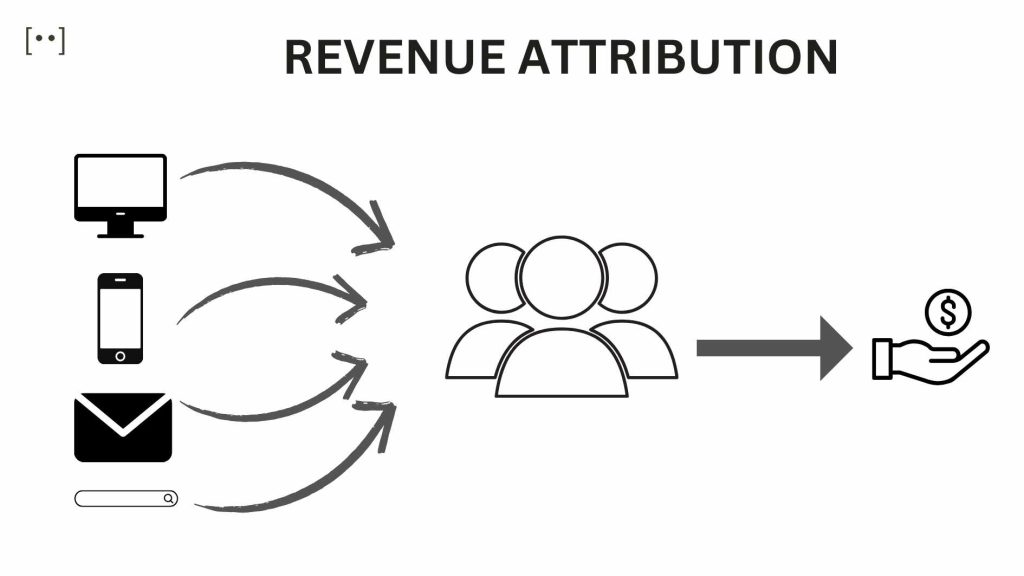
This is where revenue attribution models come in. Revenue attribution models are a set of rules that assign a percentage of the revenue value to each touchpoint in the customer journey. By using revenue attribution models, you can understand how your customers interact with your brand across different channels and stages, and how each interaction contributes to your bottom line.
However, not all revenue attribution models are created equal. Depending on your business goals, sales cycle, and customer behavior, some models may be more suitable for you than others. In this article, we will explain the different types of revenue attribution models, their pros and cons, and how to choose the right one for your business.
What are the types of revenue attribution models?
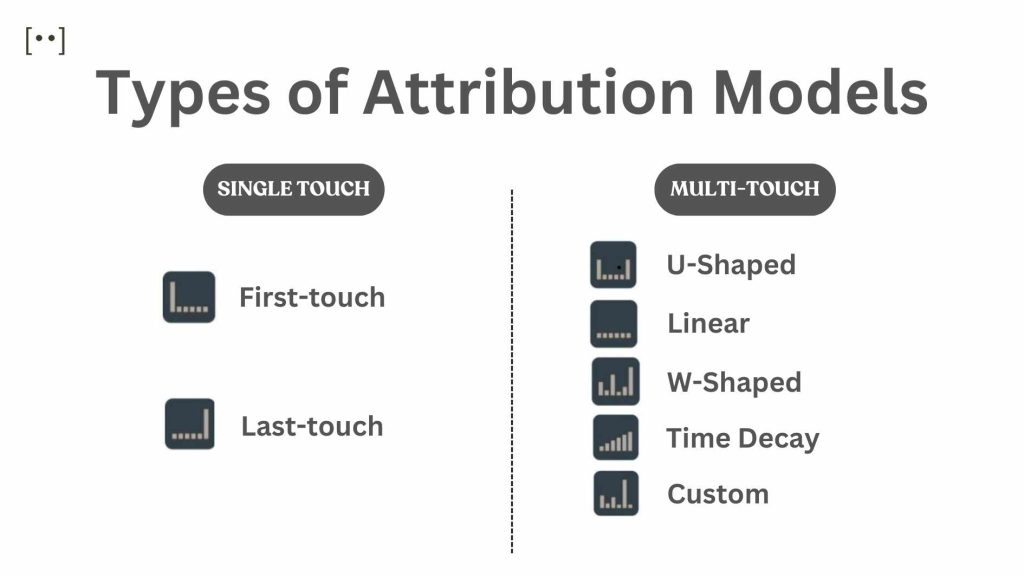
Revenue attribution models can be broadly classified into two categories: single-touch and multi-touch.
Single-touch models
Single-touch models give 100% of the credit to one touchpoint in the customer journey, either the first or the last one. These models are simple and easy to implement, but they ignore the complexity and nuance of the customer journey. They also tend to overvalue certain channels and undervalue others, leading to inaccurate and biased results.
1. First-touch model
The first-touch model attributes all the revenue to the first touchpoint that brought the customer to your website or business. For example, if a customer clicked on a Facebook ad, signed up for your newsletter, and then made a purchase, the Facebook ad would get all the credit.
Use case: The first-touch model is useful for measuring the effectiveness of your top-of-the-funnel marketing activities, such as brand awareness and lead generation. It can help you identify which channels are best at attracting new customers and driving traffic to your website.
2. Last-touch model
The last-touch model attributes all the revenue to the last touchpoint that the customer interacted with before making a purchase. For example, if a customer clicks on a Facebook ad, signs up for your newsletter, and then makes a purchase, the newsletter will get all the credit.
Use case: The last-touch model is useful for measuring the effectiveness of your bottom-of-the-funnel marketing activities, such as conversions and sales. It can help you identify which channels are best at closing the deal and influencing the final purchase decision.
Multi-touch models
Multi-touch models distribute the credit among multiple touchpoints in the customer journey, based on different weighting schemes. These models are more complex and sophisticated, but they capture the reality and diversity of the customer journey. They also provide a more balanced and holistic view of the performance of your marketing channels and campaigns.
1. Linear model
The linear model assigns equal credit to all the touchpoints in the customer journey. For example, if a customer clicked on a Facebook ad, signed up for your newsletter, and then made a purchase, each touchpoint would get 33.3% of the credit.
Use case: The linear model is useful for measuring the overall impact of your marketing efforts across the entire customer journey. It can help you understand how each channel and campaign contributes to your revenue, without favoring any particular stage or touchpoint.
2. Time-decay model
The time-decay model assigns more credit to the touchpoints that are closer to the purchase, and less credit to the ones that are farther away. For example, if a customer clicks on a Facebook ad, signs up for your newsletter, and then makes a purchase, the newsletter would get the most credit, followed by the Facebook ad, and then the initial visit.
Use case: The time-decay model is useful for measuring the impact of your marketing efforts on short-term sales and conversions. It can help you identify which channels and campaigns are most effective at driving immediate results and influencing the final purchase decision.
3. U-shaped model
The U-shaped model assigns 40% of the credit to the first and last touchpoints and distributes the remaining 20% equally among the other touchpoints. For example, if a customer clicked on a Facebook ad, signed up for your newsletter, and then made a purchase, the Facebook ad and the newsletter would each get 40% of the credit, and the initial visit would get 10%.
Use case: The U-shaped model is useful for measuring the impact of your marketing efforts on lead generation and conversions. It can help you identify which channels and campaigns are best at attracting new leads and closing the deal, while also acknowledging the role of the other touchpoints.
4. W-shaped model
The W-shaped model assigns 30% of the credit to the first, last, and middle touchpoints, and distributes the remaining 10% equally among the other touchpoints. The middle touchpoint is the one that marks the transition from a lead to an opportunity. For example, if a customer clicked on a Facebook ad, signed up for your newsletter, requested a demo, and then made a purchase, the Facebook ad, the newsletter, the demo, and the purchase would each get 30% of the credit, and the initial visit would get 5%.
Use case: The W-shaped model is useful for measuring the impact of your marketing efforts on lead generation, lead nurturing and conversions. It can help you identify which channels and campaigns are best at attracting new leads, moving them along the sales funnel, and closing the deal, while also acknowledging the role of the other touchpoints.
5. Custom model
The custom model allows you to create your own rules and weights for assigning credit to the touchpoints in the customer journey. You can use any criteria or logic that suits your business goals and needs. For example, you can assign more credit to certain channels, campaigns, or actions that you consider more valuable or important for your revenue.
Use case: The custom model is useful for measuring the impact of your marketing efforts on any specific objective or outcome that you want to achieve. It can help you tailor your attribution model to your unique business situation and strategy, and optimize your marketing performance accordingly.
How to choose the right revenue attribution model for your business?
There is no one-size-fits-all solution when it comes to revenue attribution models. The best model for your business depends on several factors, such as:
- Your business goals and objectives
- Your sales cycle and customer journey
- Your marketing channels and campaigns
- Your data availability and quality
- Your analytics tools and capabilities
To choose the right revenue attribution model for your business, you need to:
Define your business goals and objectives: What are you trying to achieve with your marketing efforts? What are the key performance indicators (KPIs) that you want to measure and improve?
Map your sales cycle and customer journey: How long does it take for a customer to go from awareness to purchase? How many touchpoints are involved in the process? What are the key stages and milestones along the way?
Analyze your marketing channels and campaigns: What are the different channels and campaigns that you use to reach and engage your customers? How do they interact and complement each other? How do they vary in terms of cost, reach, and effectiveness?
Assess your data availability and quality: What kind of data do you have access to and how reliable is it? How do you collect, store, and integrate your data across different sources and platforms? How do you ensure data accuracy and consistency?
Evaluate your analytics tools and capabilities: What kind of analytics tools do you use and how advanced are they? How do they support your revenue attribution needs and goals? How do they enable you to track, measure, and report your revenue attribution results?
Based on these factors, you can compare and contrast the different revenue attribution models and select the one that best fits your business context and requirements. You can also test and experiment with different models and see how they affect your revenue attribution insights and outcomes.
How can Pixage help you with revenue attribution?
Pixage is the ONE application that allows digital marketing managers to manage their screens centrally. It is designed for brands and advertisers with an e-commerce website. Pixage allows users to:
Attribute sales to ads: Pixage tracks and connects the online and offline customer journey, showing how your ads influence your sales. You can see which ads are driving the most revenue, and optimize your ad spend accordingly.
Analyze campaign performance: Pixage measures and compares the performance of your campaigns across different channels, platforms, and devices. You can see how your campaigns are impacting your revenue, and adjust your strategy accordingly.
Switch between attribution models: Pixage supports multiple revenue attribution models and allows you to switch between them easily and quickly. You can choose the model that best suits your business goals and needs, and see how it affects your revenue attribution results.
Understand what is driving business for clients: Pixage provides you with actionable insights and recommendations on how to improve your revenue attribution and marketing performance. You can understand what is driving business for your clients, and deliver more value and satisfaction to them.
Pixage is the ultimate solution for digital marketing managers who want to master revenue attribution and grow their business. With Pixage, you can:
- Track the performance of your marketing campaigns and analyze the customer touchpoints
- Attribute revenue to your marketing channels and campaigns, and optimize your marketing budget
- Switch between different revenue attribution models, and choose the right one for your business
- Understand what is driving business for your clients, and increase your customer loyalty and retention
If you want to learn more about Pixage and how it can help you with revenue attribution, visit https://www.pixage.io/ today and request a trial.